The article was published in the Journal of Biomedical and Health Informatics and is available here.
Supplementary Material
Appendix A: Hyper-parameter sensitivity analysis
The importance of different hyper-parameters and the network structure were evaluated through an ablation study. To achieve a reliable result for each configuration, we performed the 6-fold nested cross-validation 50 times with different seeds due to variations of the results with different seeds. The total number of different hyper-parameters was limited as we trained multiple (300) networks for each configuration. Table A.1 shows the configurations evaluated.
The output from the attention module (ATT) yielded no improvement over the output from the RNN module. However, both showed a great improvement over the output from the CNN module. Larger model complexity through the increased value of k showed a slightly positive trend. The trend was consistent for each output stage (CNN, RNN, ATT), normalization layer, pooling layer, and localization head. Using a data-driven localization head (ωAVO, ωAVC) did not result in superior performance compared to using static values (ωAVO=0.5, ωAVC=0.5) for the ATT and RNN output stages. However, the data-driven localization head showed enhanced performance in the output from the CNN stage. The data-driven localization head therefore seems to be a critical design parameter when the feature extractor is suboptimal (compare e.g. C29-C32 to C33-C36 in Table. A.1). C2 and C56 show a comparison between the learning rates 10-3 and 10-4. We found 10-4 to be a reasonable learning rate. The overall performance was similar between batch normalization (BN) and group normalization (GN). Group normalization resulted typically in a lower average error (%), while batch normalization gave a lower mean absolute error (ms). The choice of using a sigmoid activation function on the regression output is not common in the literature. However, we found it to improve the results. For comparison see C2 vs. C55.
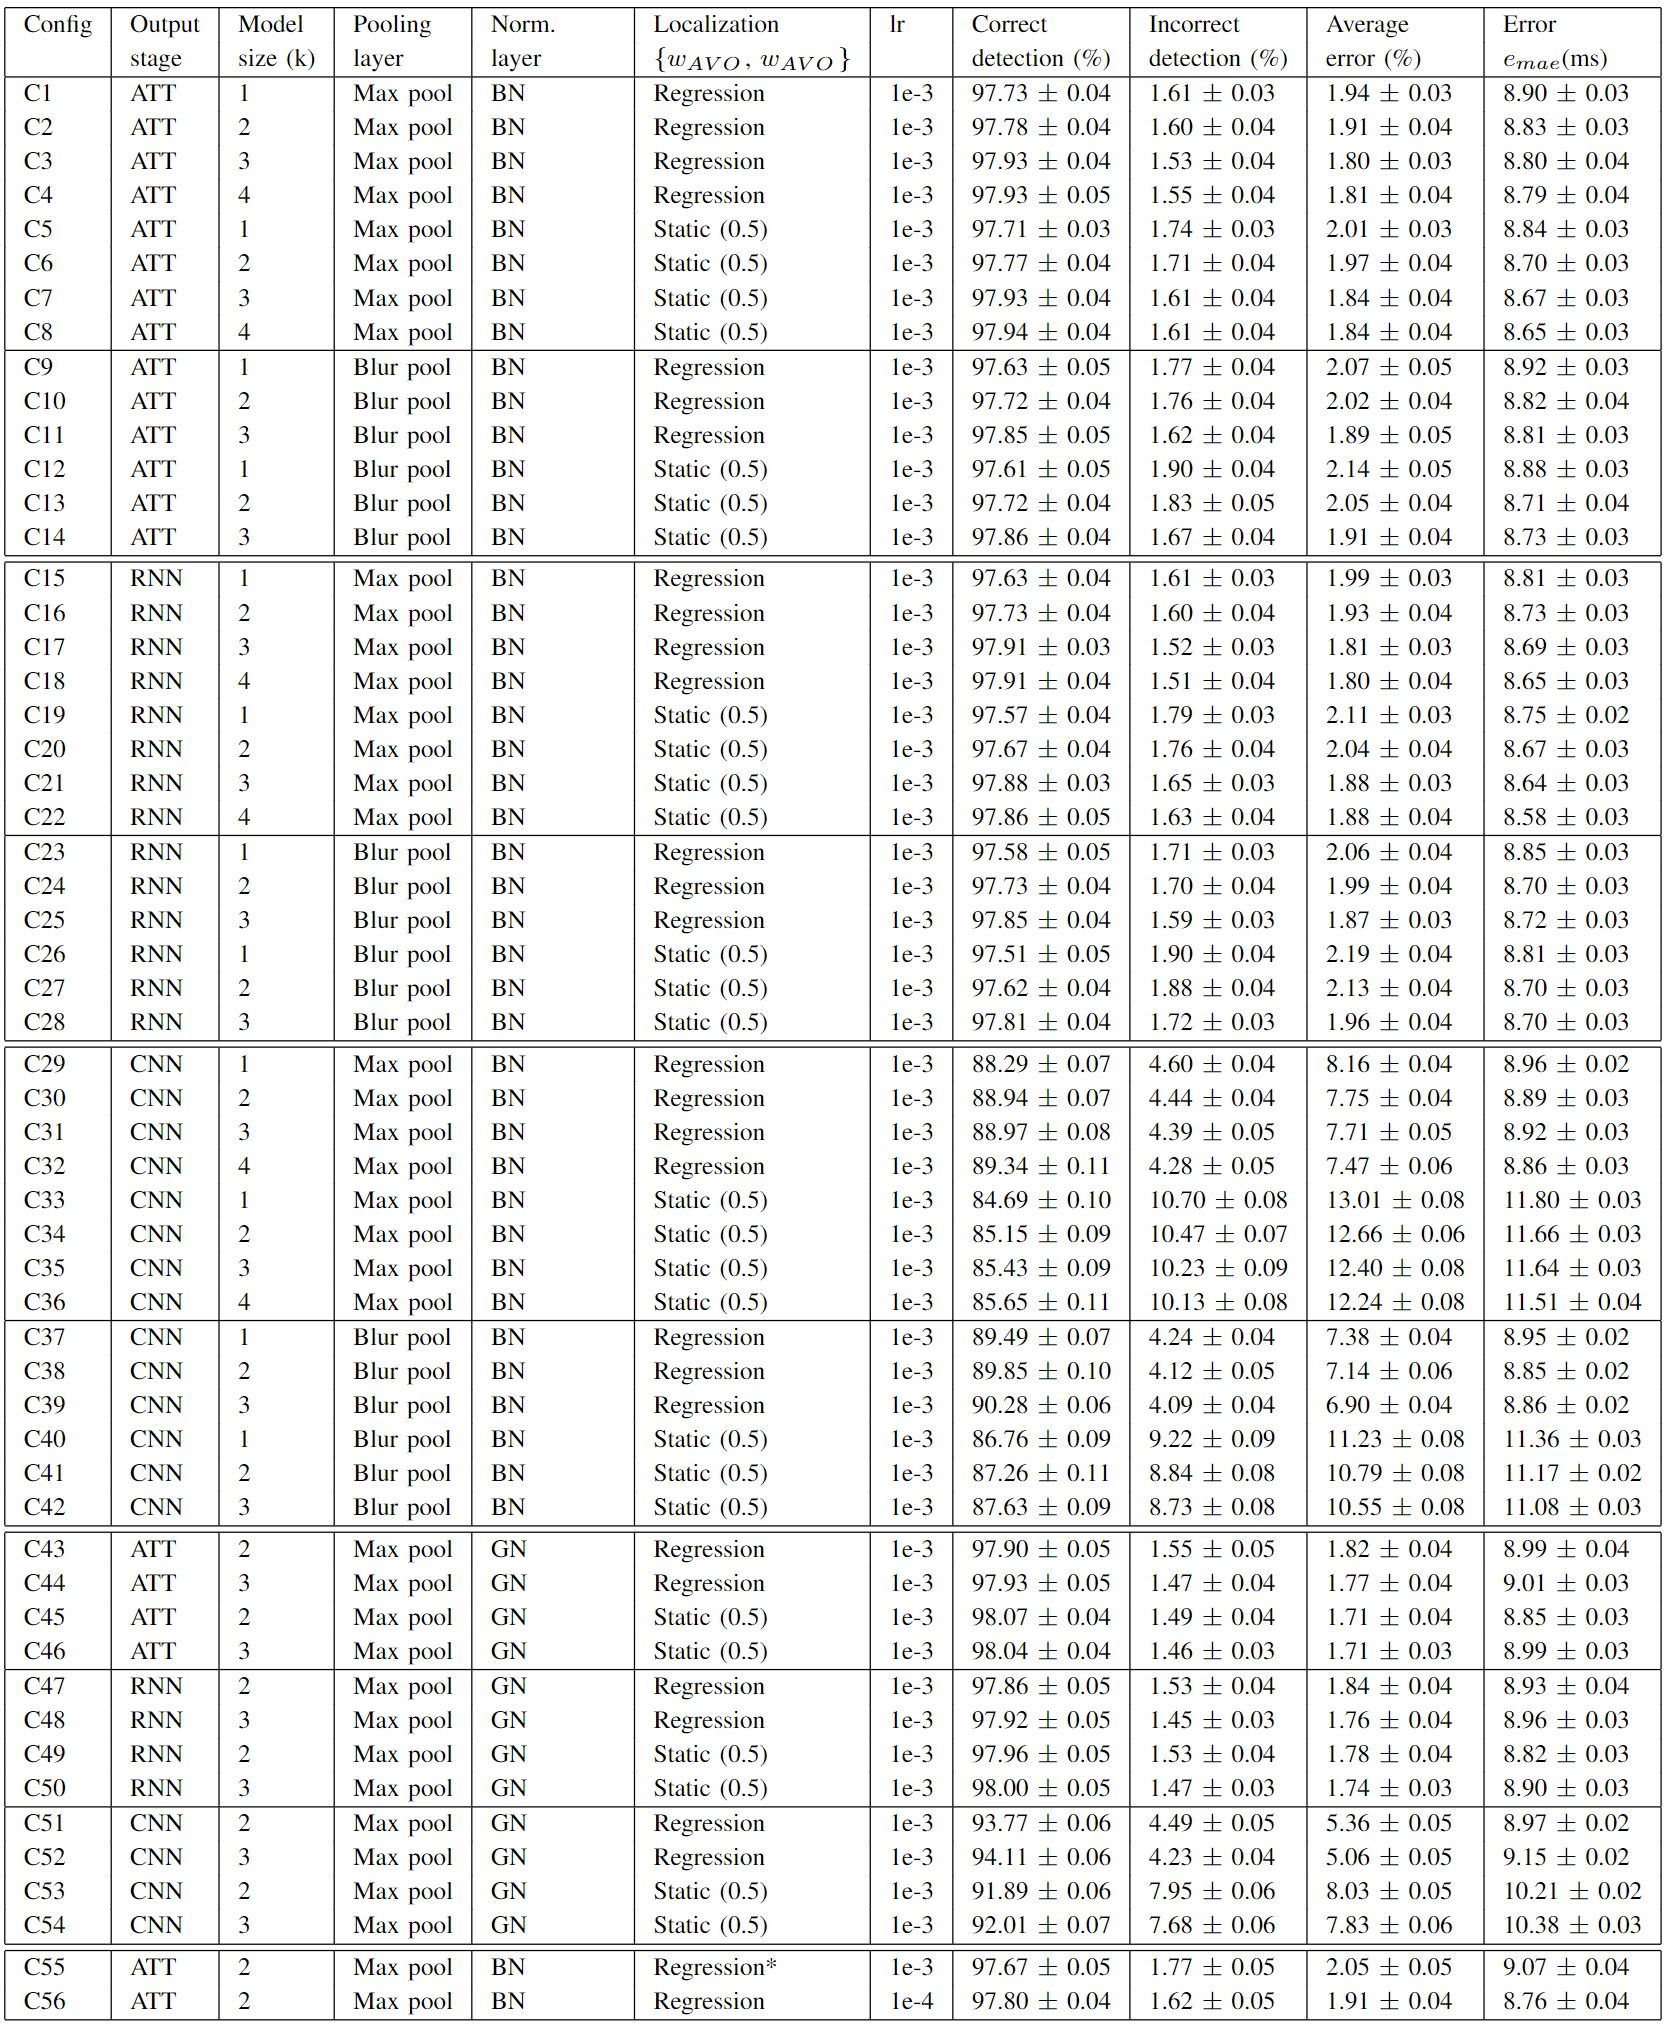
Table A.1: The table shows the sensitivity of different hyper-parameters. The results are calculated by averaging both the species, canines and porcines, and both the events, AVO and AVC. The values are given as μ ± Δμ, where μ is the mean and Δμ the uncertainty of the mean from 50 nested cross-validation runs with different seeds. BN: Batch normalization, GN: Group normalization, lr: Learning rate, MBP: Max Blur Pool, *: Linear activation (no sigmoid). The definition of the average error is given in Equation [8]
Appendix B: Comparing results on canine and porcine data sets
We trained and tested the network on canines’ and porcines’ data sets separately to see how that may alter the results. We found that using individual species’ data sets for training and testing yielded similar results to using merged data sets, see Table B.1.
An interesting observation is that a network trained on the porcine data set performed surprisingly well while being tested on the canine data set. Though, a network trained on canine data set did not yield similarly good results on the porcine test set, which could be due to less canine data and/or different interventions. The only difference we found in the hyper-parameter search in terms of using individual data sets, was that group normalization tends to perform better in canines while batch normalization tends to performs better in porcines.
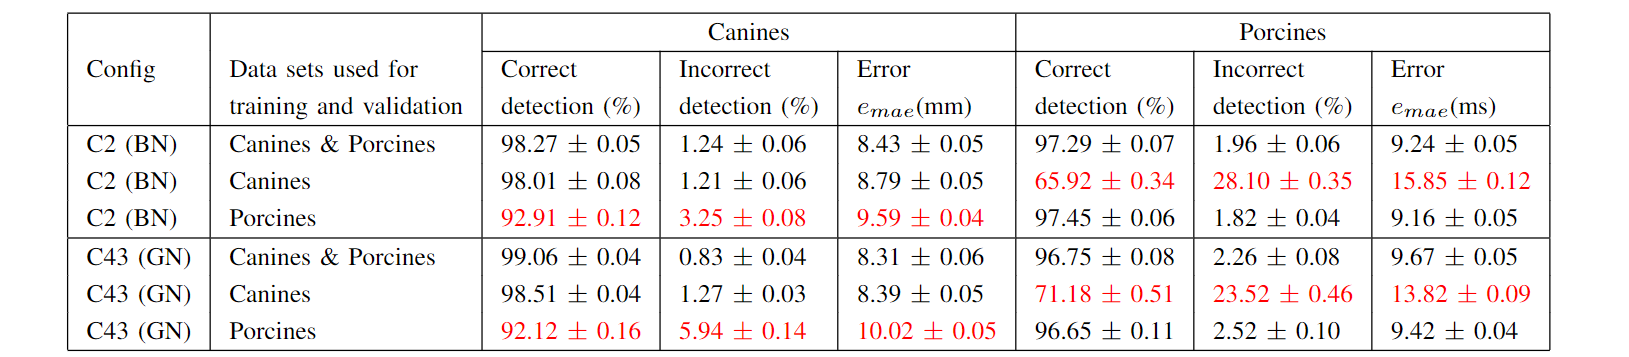 Table B.1: The hyper-parameter configurations C2 and C43 can be found in Table A.1. The network was not trained for the species that have results marked in red.